
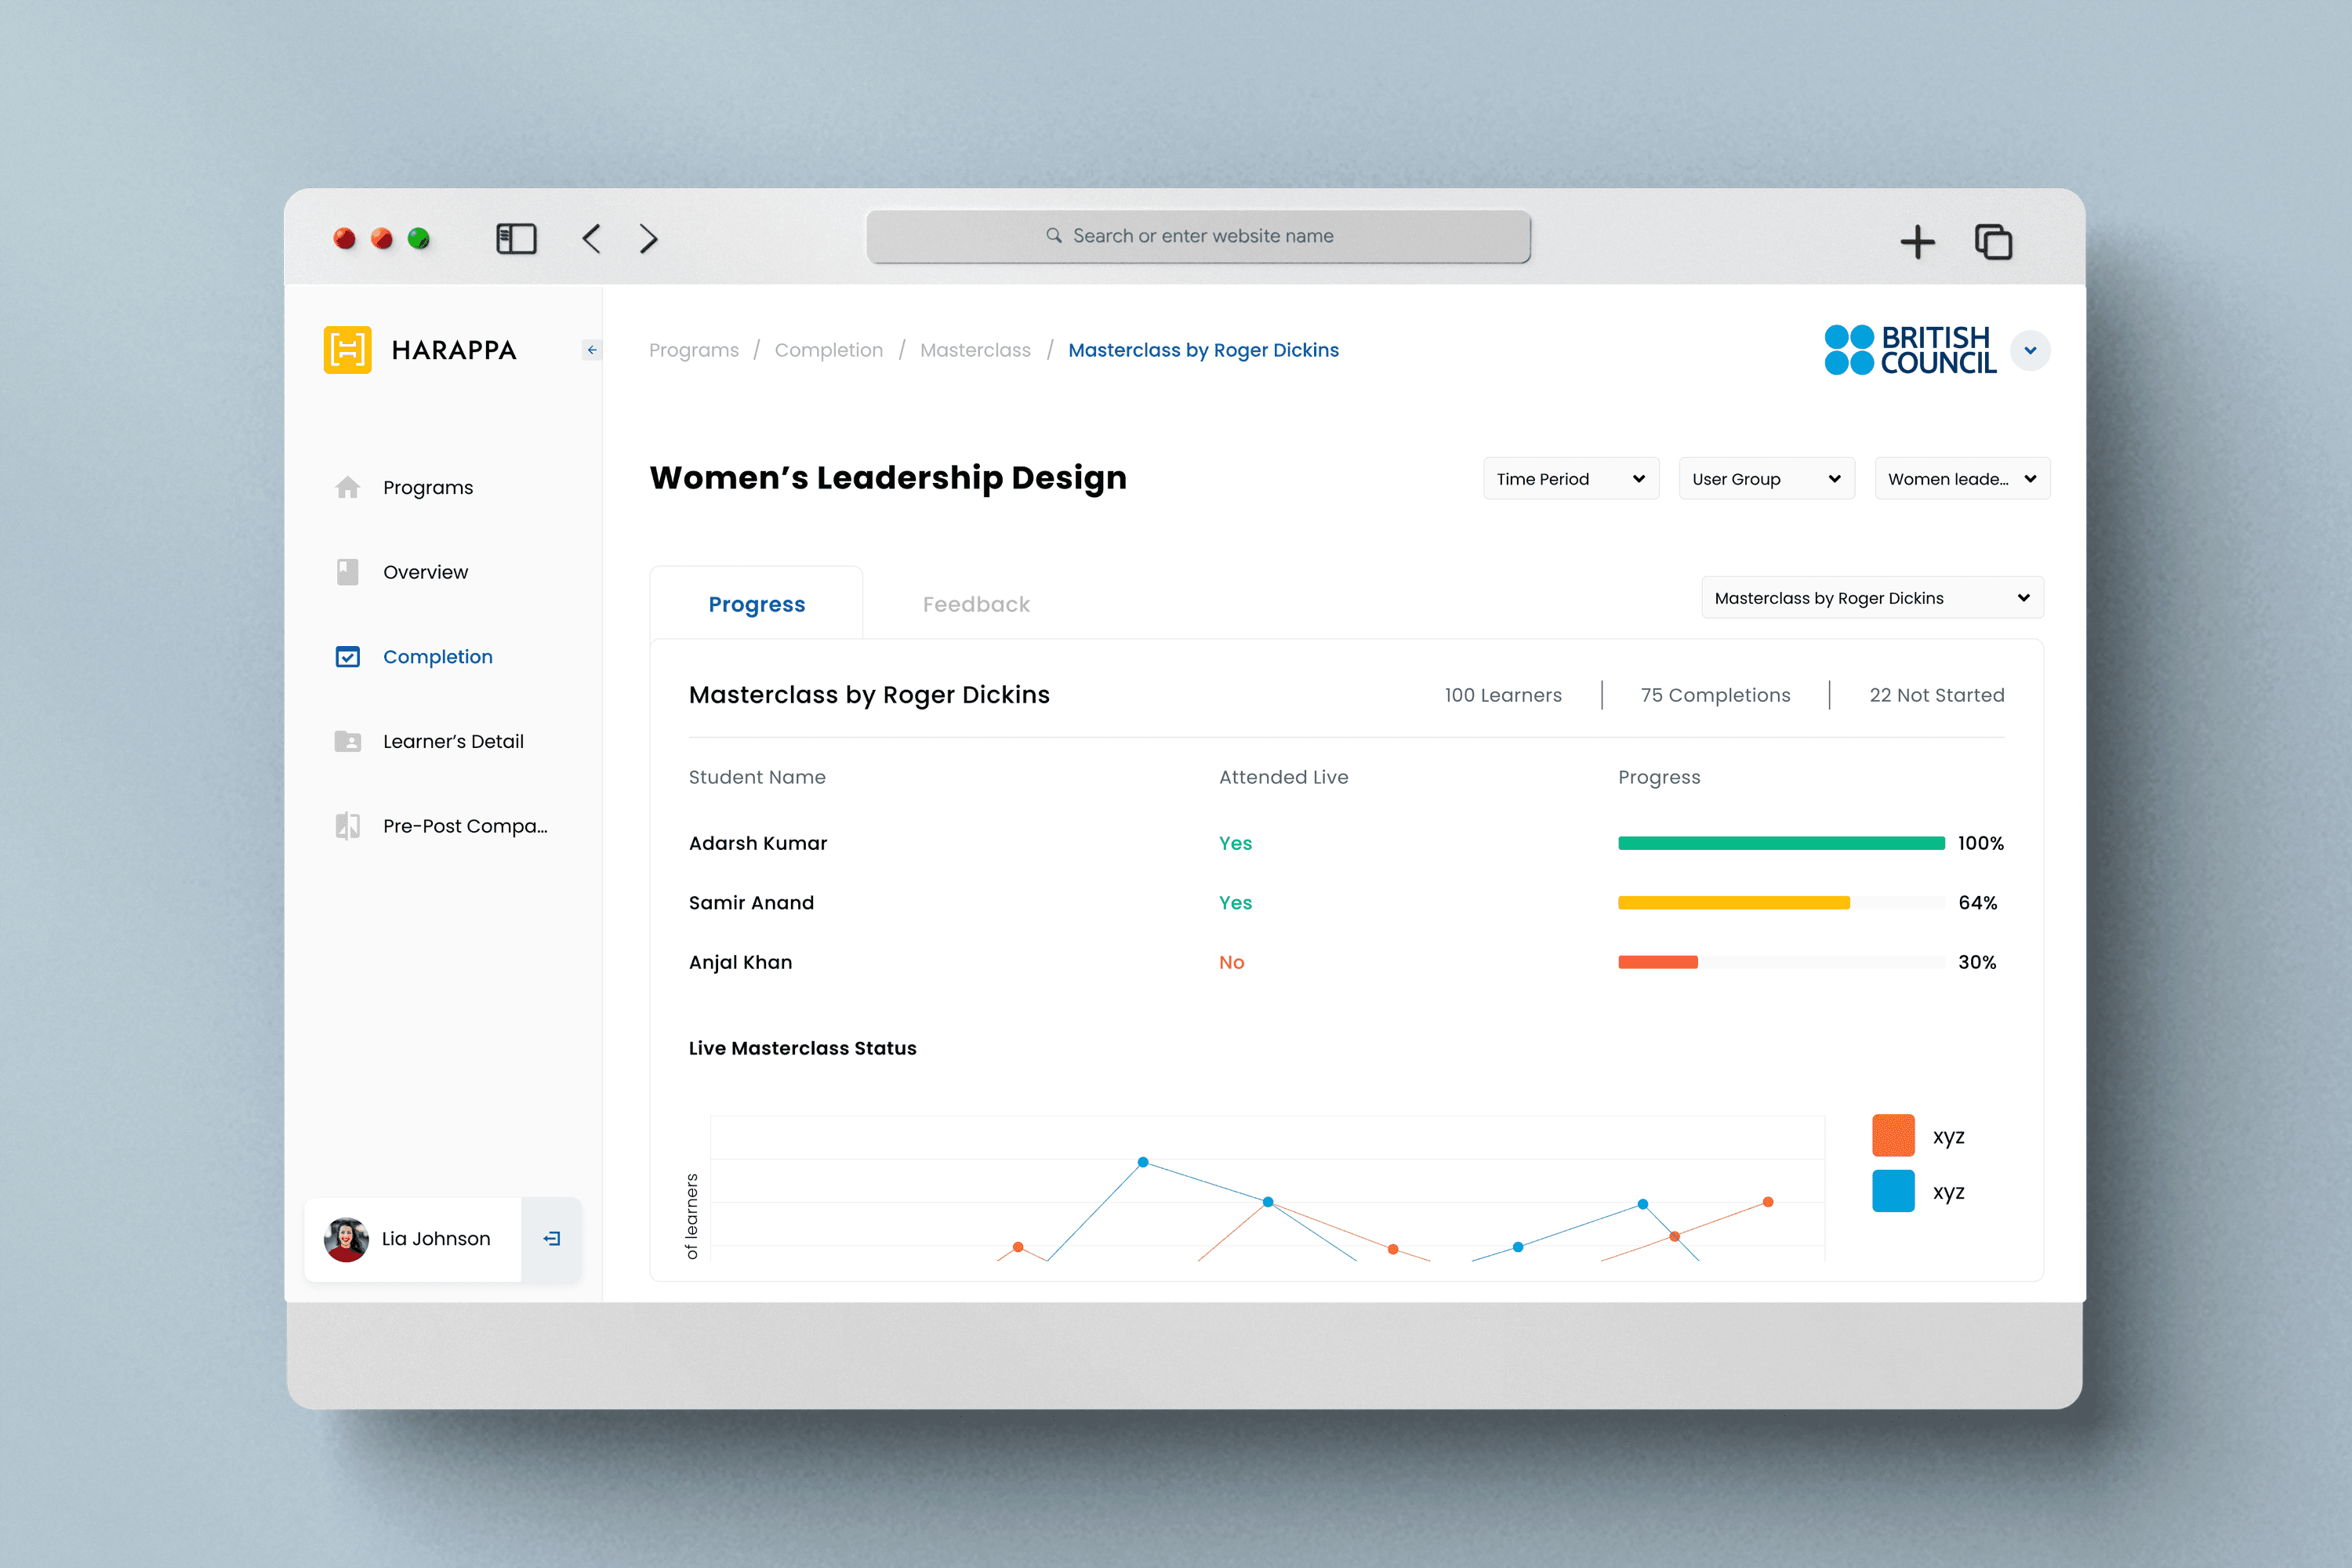
Harappa Partner Dashboard
It was designed to ease the client's pain while tracking their employee progress and data. Earlier our clients use to monitor data of their users by excel sheet so we planned to design a dashboard for that so they can easily track their user progress.

New Delhi, India
2018
Ed-tech
$21.2 Million (2021)
150+
Challenge
The excel sheet (csv file) had a cluttered interface, making it difficult for clients to navigate and find essential data. Clients were facing issues with the on-boarding process. The sheet lacked personalization and customization options, making it less engaging and user-friendly. Idea was design a dashboard which can ease the client's pain.
Results
The improved onboarding process resulted in a 35% increase in new user adoption rates.
The addition of personalization and customization options enhanced user engagement, leading to a 25% increase in user retention rates.
35%
Improved onboarding process
25%
Increase in user retention
84%
Increase in time spent on dashboard
Process
Research & Analysis: We engaged in user interviews, surveys, and examined dashboard analytics to gain insights into user needs and identify pain points. Additionally, we conducted a thorough analysis of competitor dashboard and industry trends to further inform our understanding.
Information Architecture: In light of the research results, we revamped the dashboard's navigation and content, prioritizing features and information in alignment with user needs.
Wireframing & Prototyping: We created low-fidelity wireframes to visualize the updated layout and navigation, continuously refining them through iterative processes driven by user feedback. Subsequently, we developed a high-fidelity, interactive prototype to assess the design.
Usability Testing: Usability tests were performed with a diverse user group to validate the design and pinpoint areas for improvement. In response to the feedback received, we implemented necessary adjustments to enhance the design.
Visual Design & Style Guide: We established a unified visual language encompassing color schemes, typography, and iconography, ensuring a consistent appearance across the entire dashboard. Additionally, a style guide was crafted to uphold design consistency in forthcoming updates.

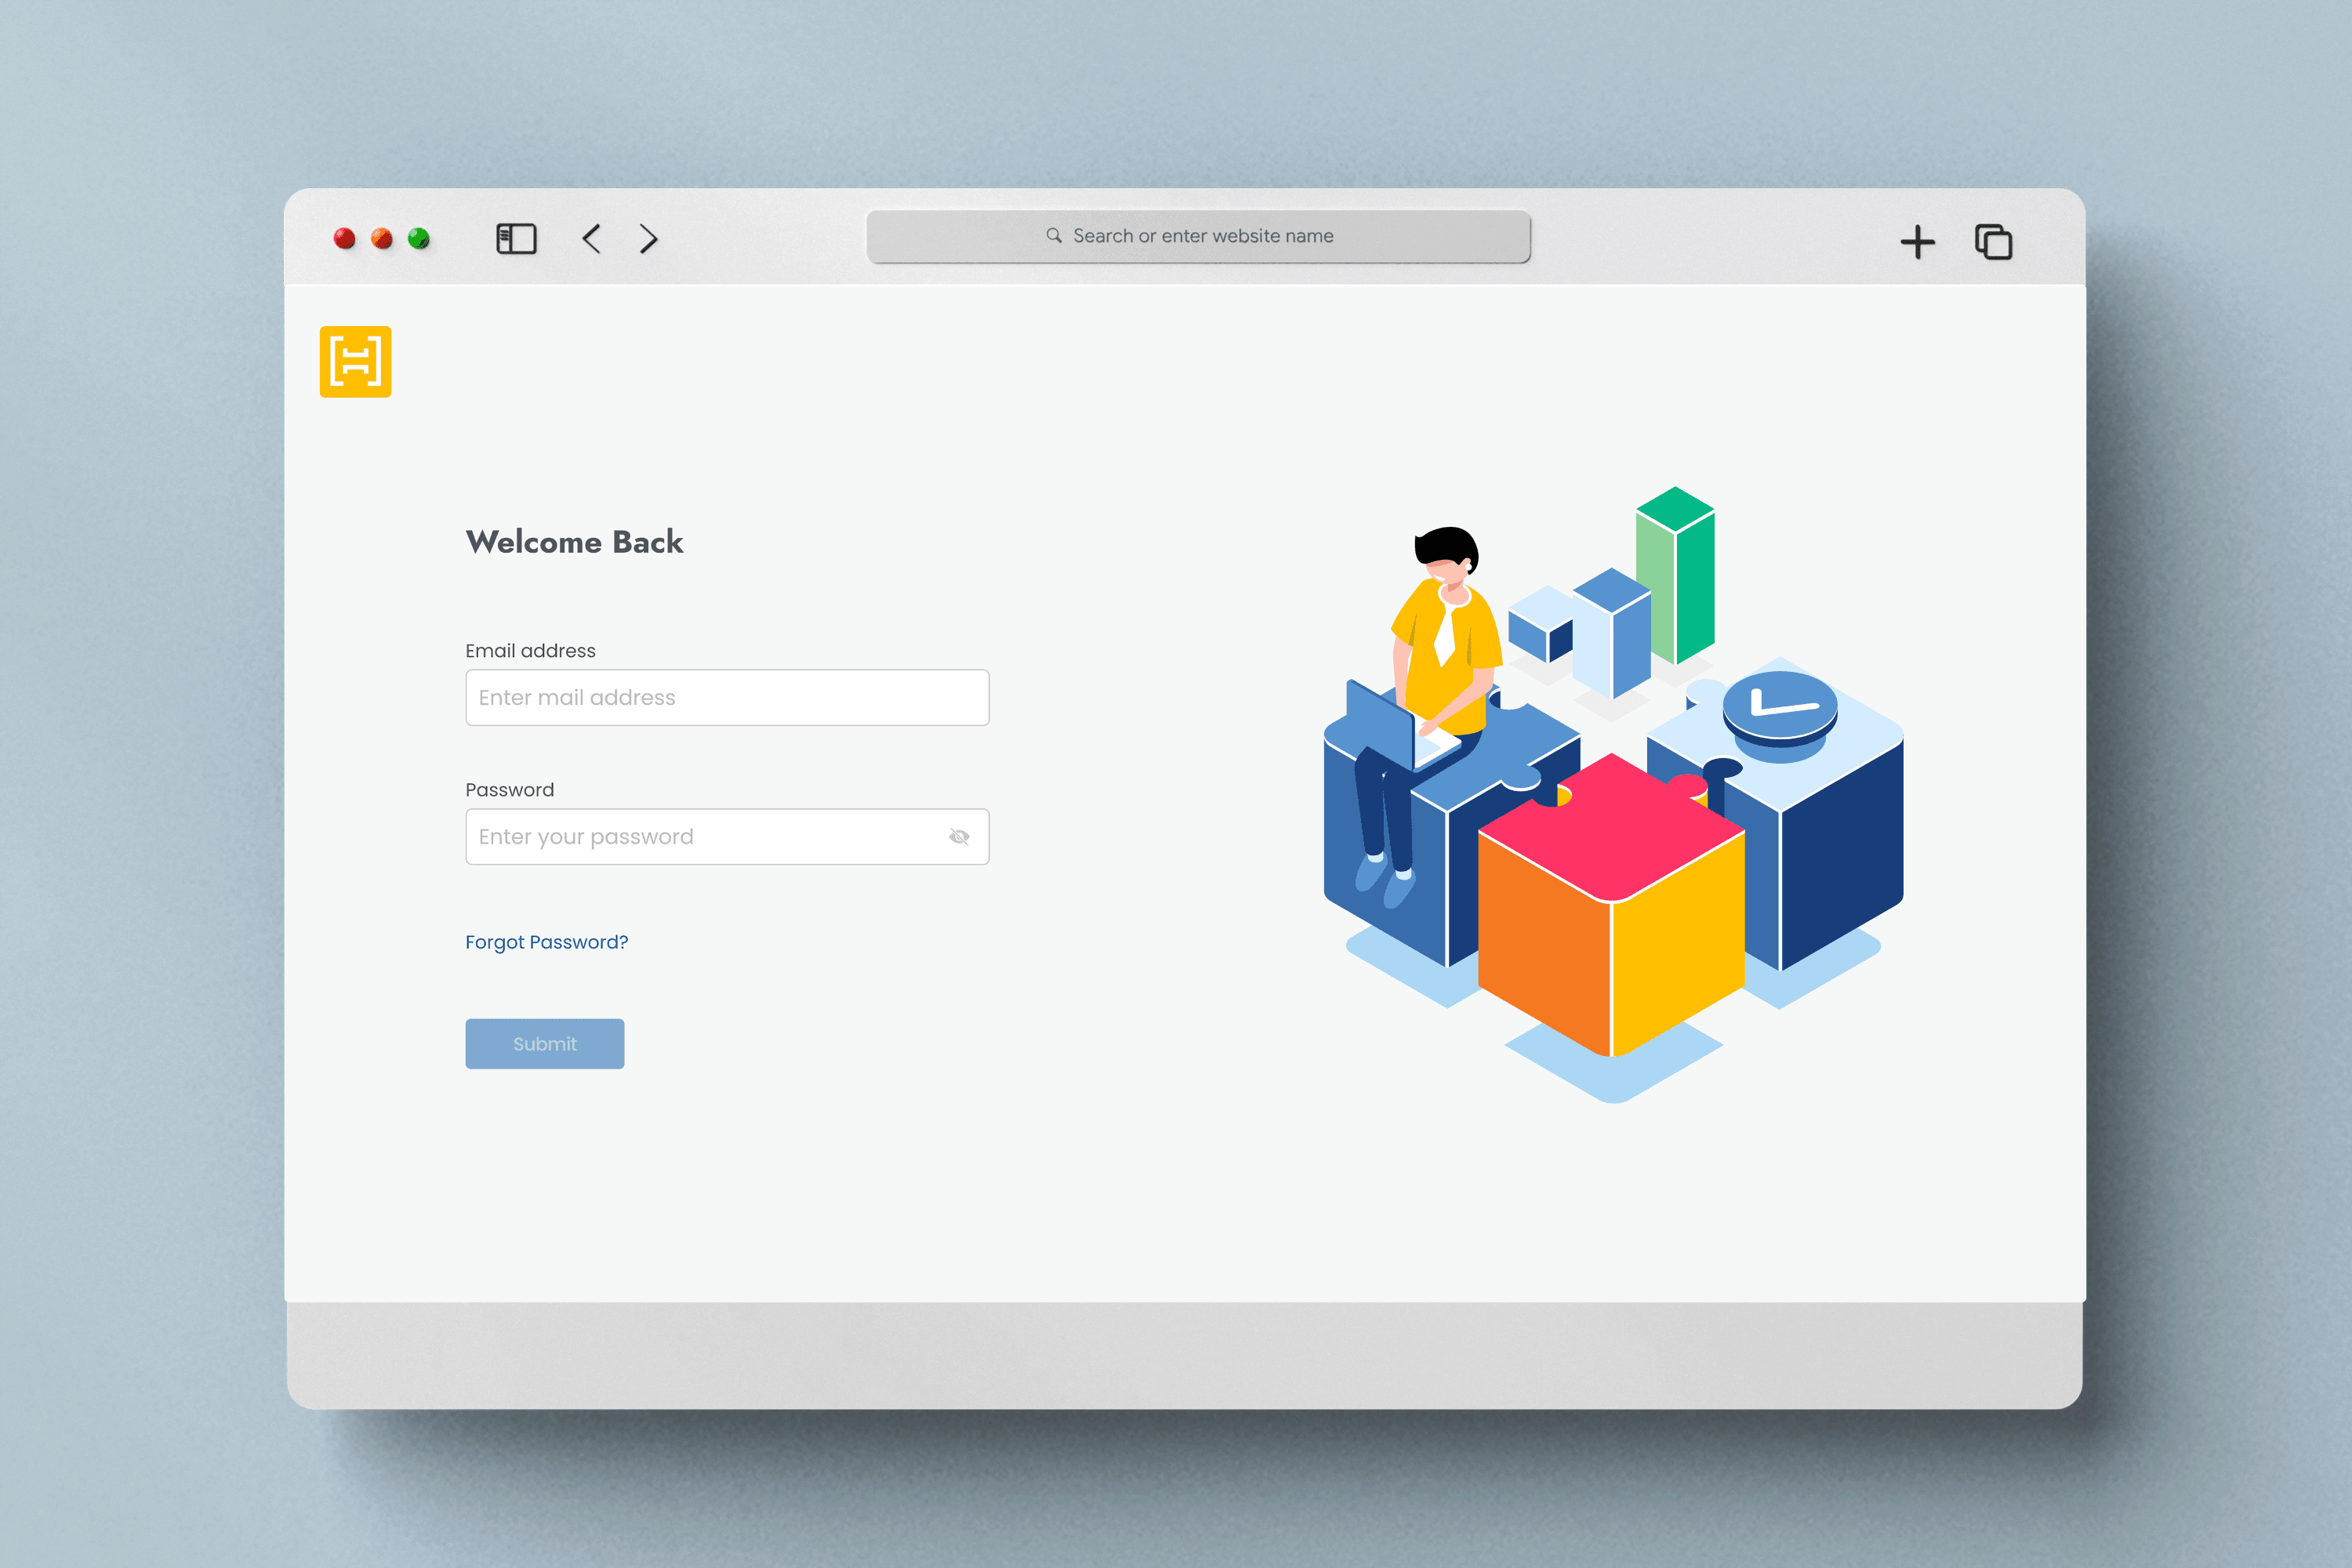
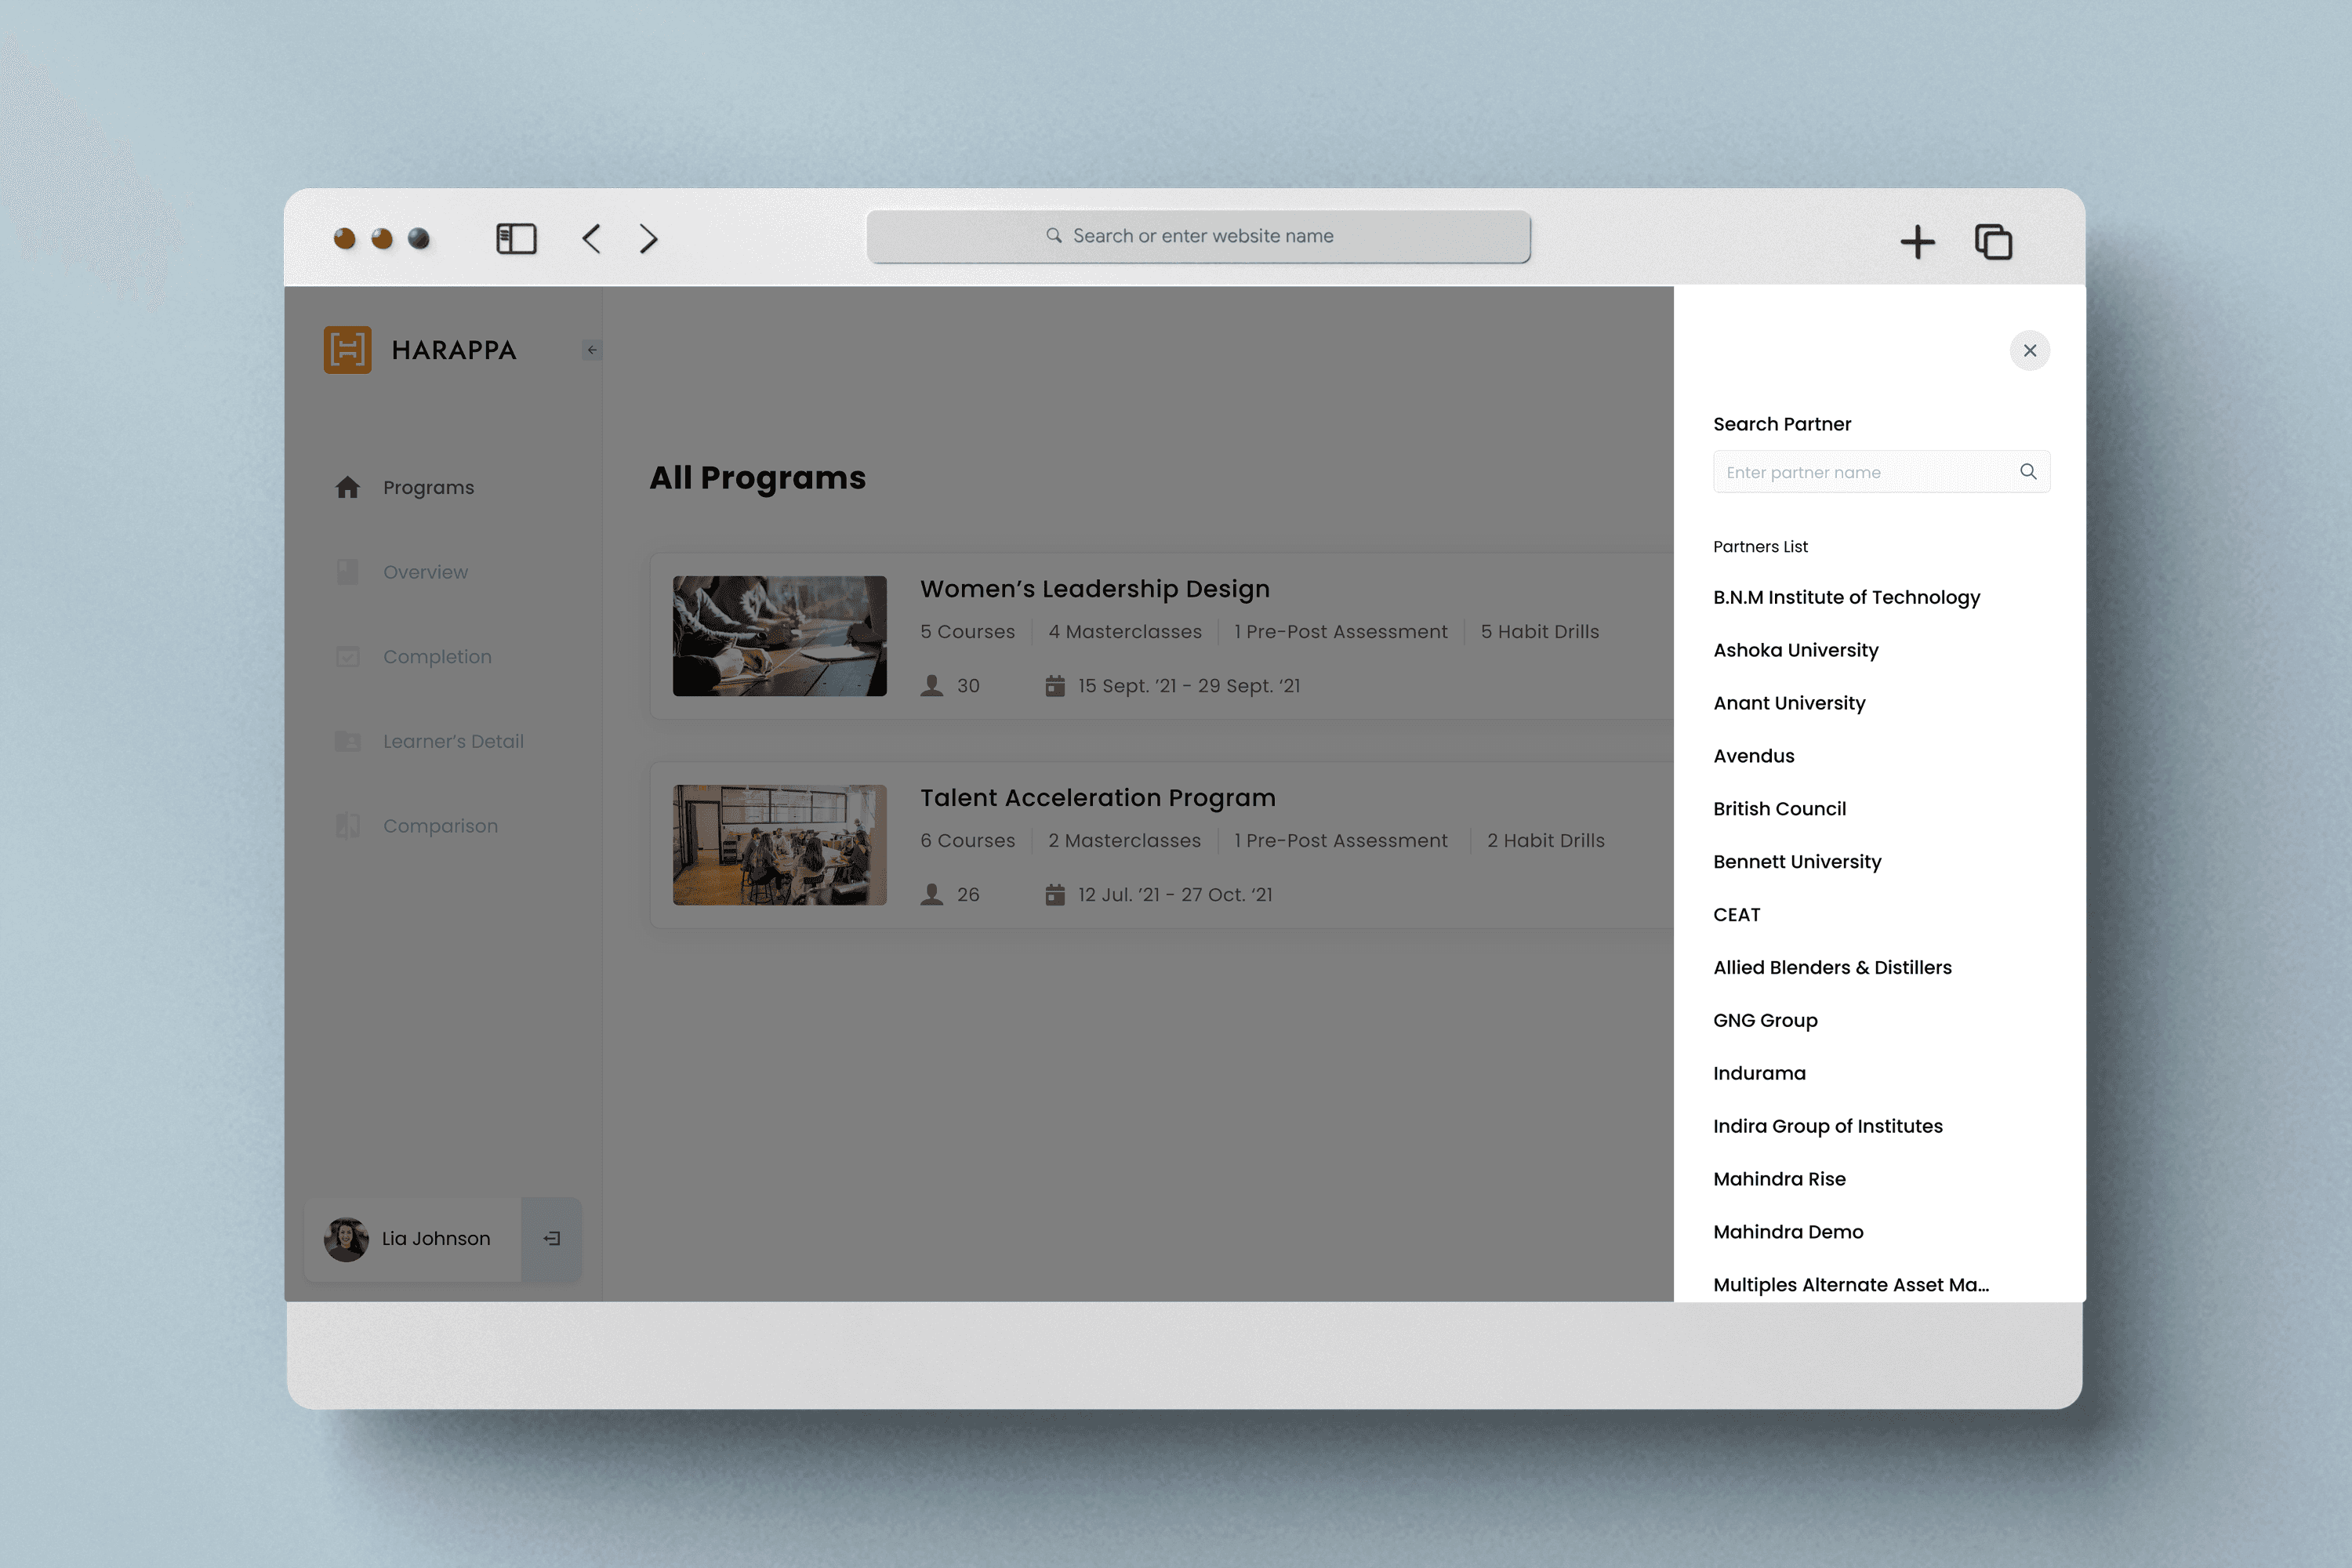
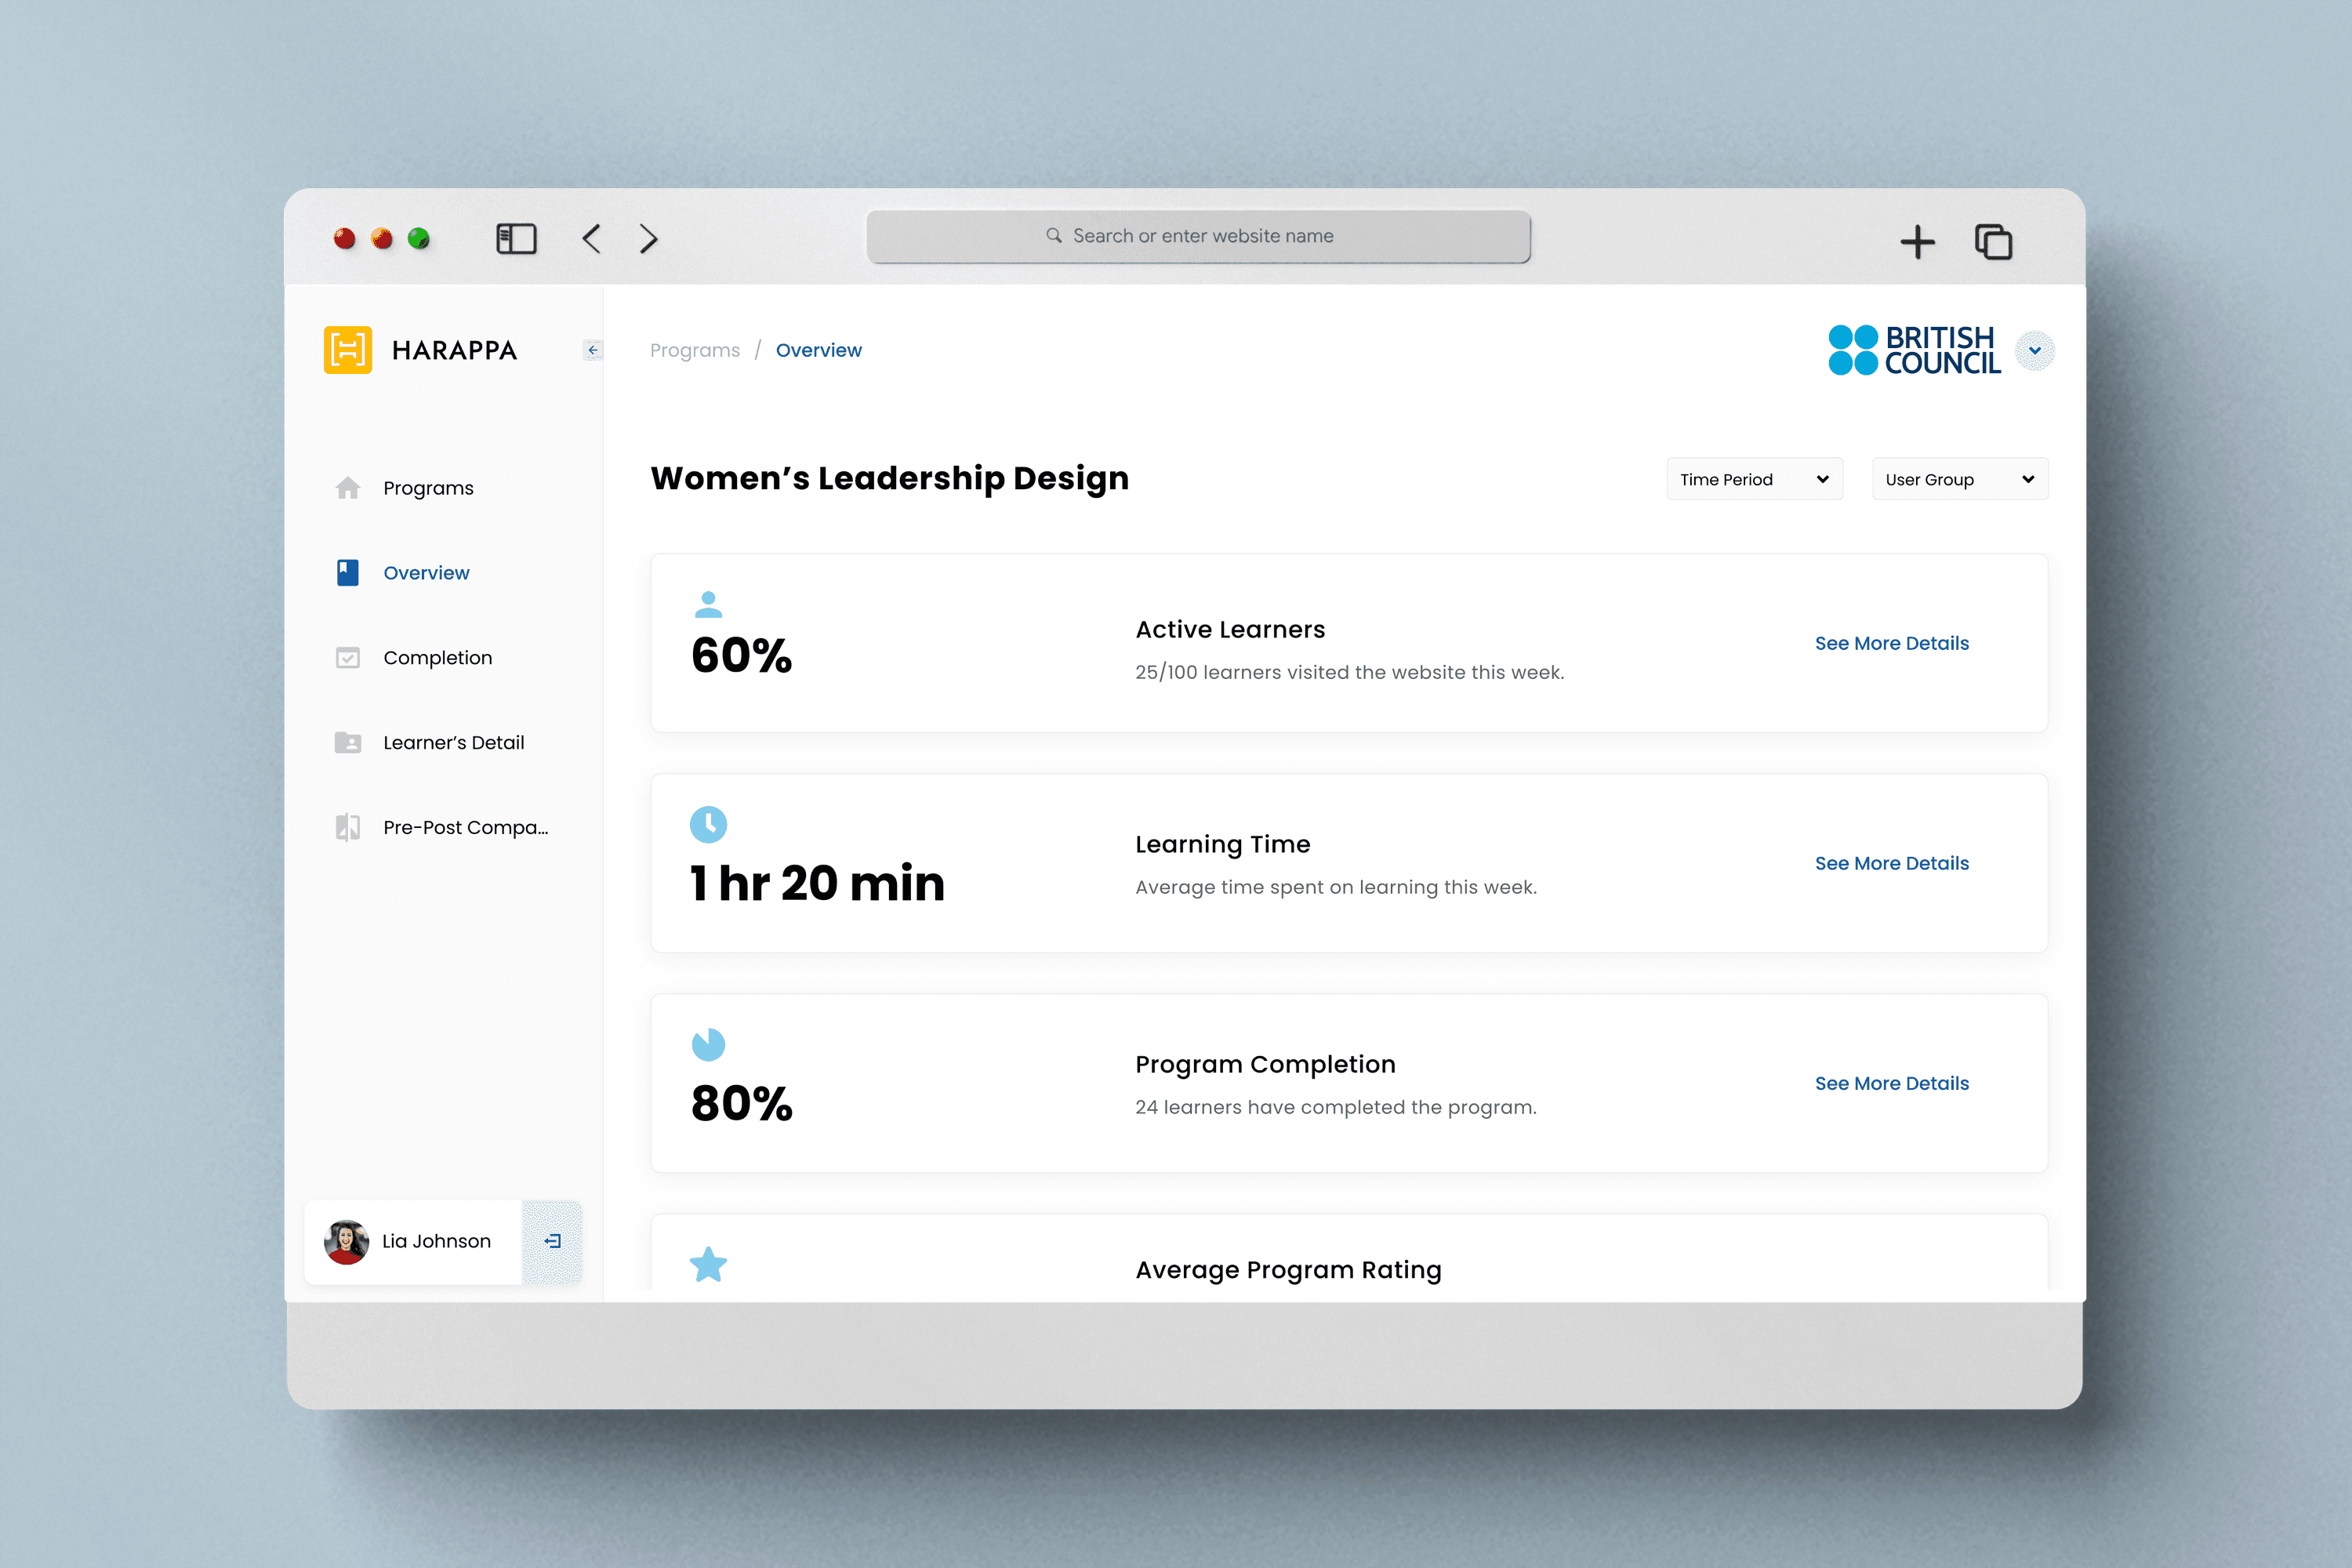
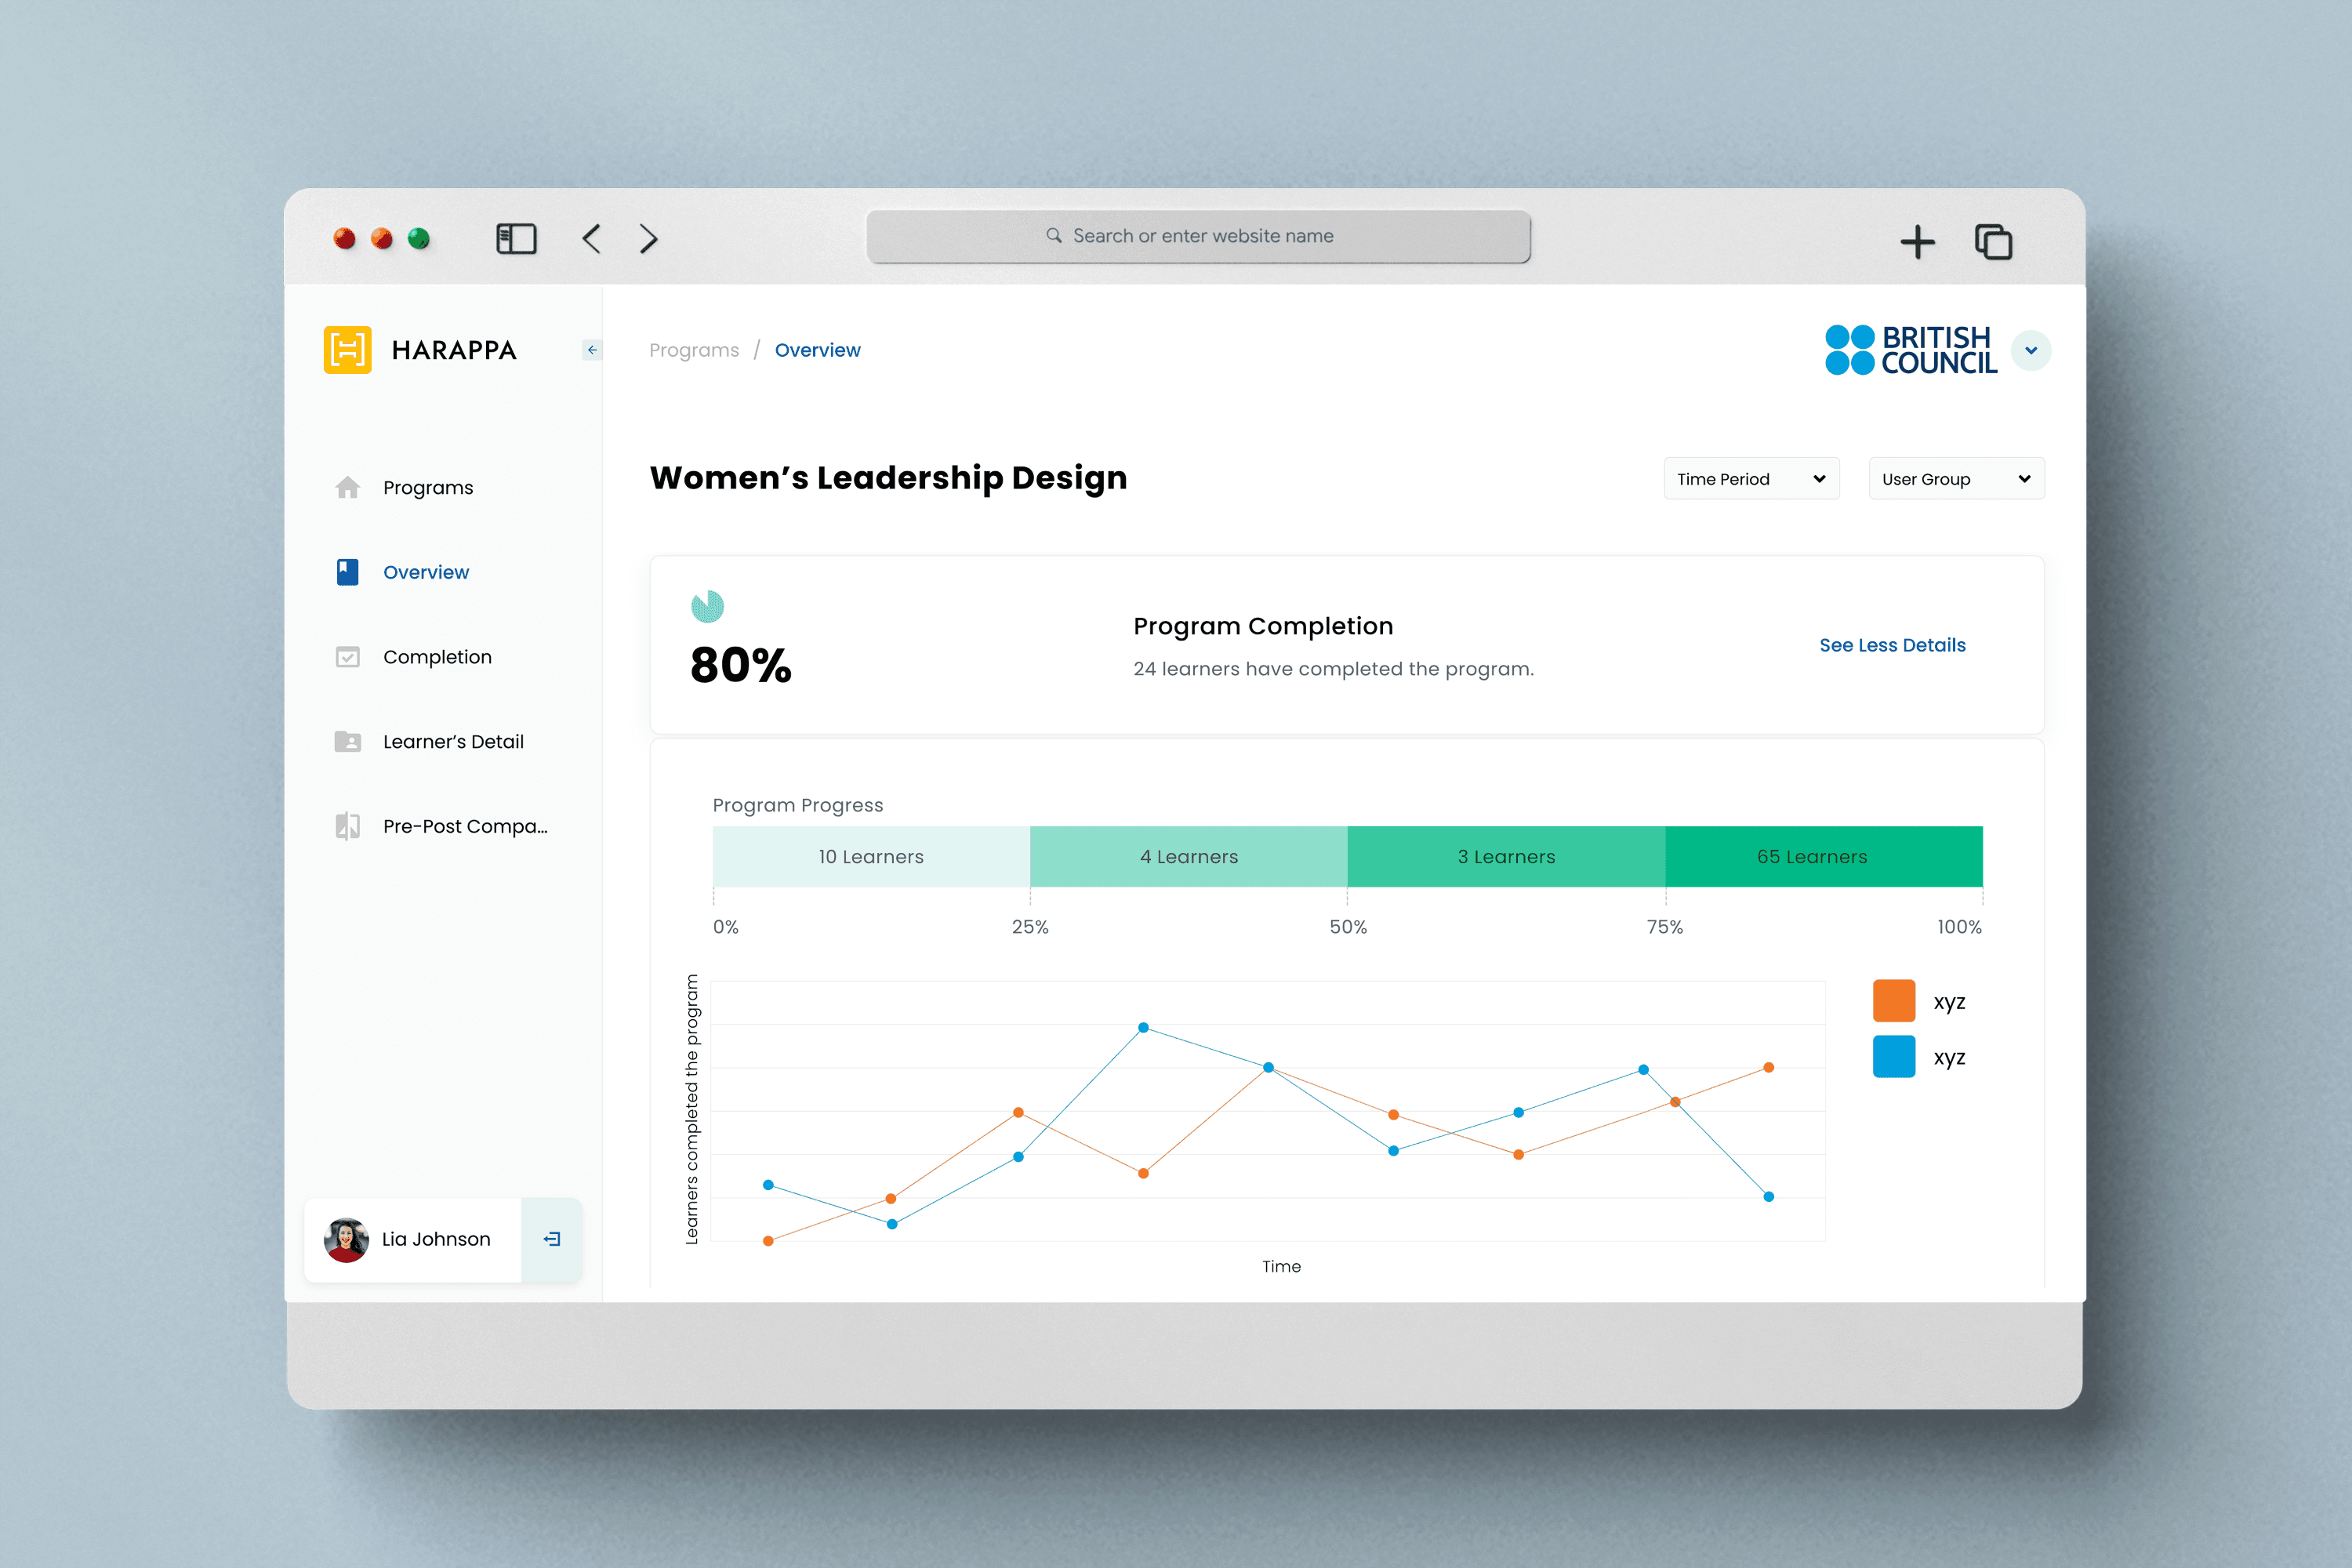
Visual Designs (You can also check the prototype here)

“ Having implemented our updated visual branding and language, the dashboard distinctly embodies the essence of our present and prospective customer base, our workforce, and our core values. ”

Pramath Raj Sinha
Co-founder | Harappa Education